previous | contents | next
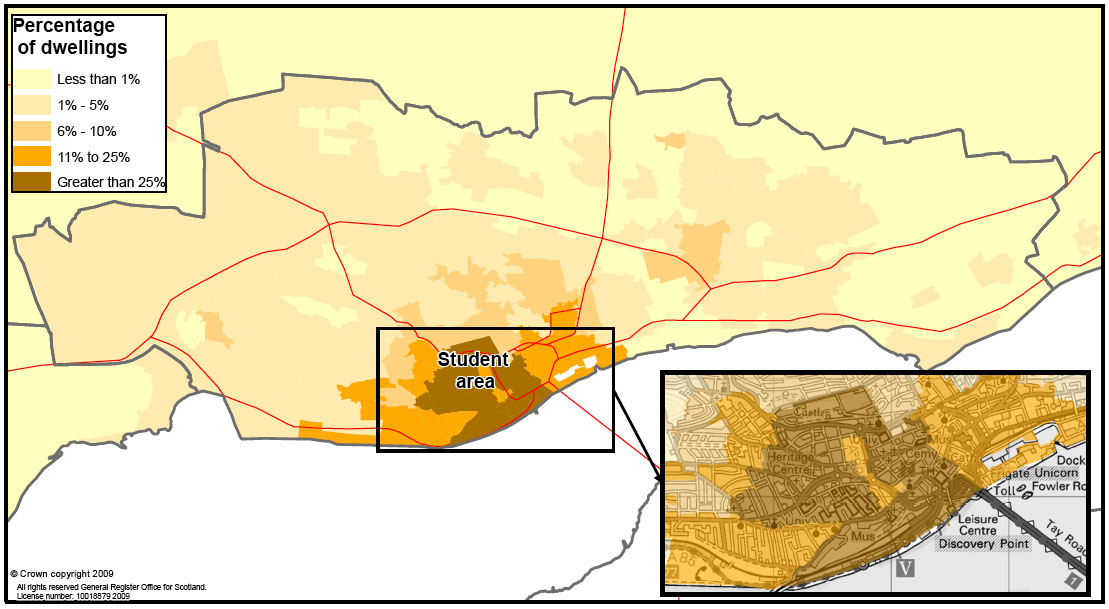
Map 4: Percentage of dwellings in each data zone with Council Tax ‘occupied exemptions’ (e.g., all-student households), Dundee, 2008