previous | contents | next
Estimates of Households and Dwellings in Scotland, 2009
3. Results
3.1 Number of households and dwellings
Table 1 shows the number of households in each local authority area in Scotland from 1991 to 2009 and Table 2 shows the number of dwellings from 2001 to 2009.
A ‘dwelling’ refers to the accommodation itself, for example a house or a flat. A ‘household’ refers to the people living together in that dwelling. The number of households will be smaller than the number of dwellings, as some dwellings are vacant or second homes. Some further adjustments are made to the figures on households – Section 4 gives more information and definitions.
These tables show the following trends:
- In mid-2009, there were 2.34 million households in Scotland – around 300,000 more than in 1991.
- The number of households in Scotland has been increasing by between 11,000 and 23,000 each year since 1991. Over the last year, there has been an increase of 13,200 households (0.6 per cent).
- The rate of growth has slowed in the past two years. From 2004 to 2009, the average yearly increase in households was 19,100. The rise from 2008 to 2009 was the lowest in the last five years.
- The number of households has increased since 2008 in every council area except Argyll and Bute (where it remained the same). Since 2004, there has been an overall increase in the number of households in all areas apart from Inverclyde (where it fell slightly). The area with the greatest increase over the last five years has been Highland (8.3 per cent).
- The total number of dwellings shows a very similar trend to the total number of households.
3.2 Characteristics of dwellings
Tables 3 to 6 show the number of dwellings by Council Tax band, type of dwelling (flat, terraced, semi-detached or detached), number of rooms per dwelling and density of housing.
These figures are summarised by urban-rural classification in Table 3 (according to the Scottish Government 6-fold urban-rural classification), by level of deprivation in Table 4 (according to the Scottish Index of Multiple Deprivation) and by local authority area in Table 5. Strategic Development Plan (SDP) areas are planning authorities which cover the four largest city regions around Aberdeen, Dundee, Edinburgh and Glasgow. Summary information is available for each SDP area and for Scotland’s two National Parks in Table 6. Background information on the Scottish Government Urban Rural Classification and the Scottish Index of Multiple Deprivation is given in Sections 4.4 and 4.5.
A description of the SDP areas and National Parks and the areas they cover, is given in Sections 4.6 and 4.7. Background information on the population by age group is included in Tables 3, 4 and 6.
These tables highlight the following trends:
Council Tax band
- The proportion of dwellings in the lower Council Tax bands (bands A-C) varies across the country. Accessible rural areas tend to have the smallest proportion of dwellings in the lower Council Tax bands.
- In general, the proportion of dwellings which are in the lower Council Tax bands increases with the level of deprivation of the area. In the most deprived areas almost all dwellings (95 per cent) are in the lower Council Tax bands, compared to just 13 per cent in the least deprived areas.
- Of the four SDP areas, Glasgow and the Clyde Valley SDP area has the highest proportion of dwellings in lower Council Tax bands (66 per cent). This compares with 54 per cent in the Aberdeen City and Shire SDP area and the Scottish average of 62 per cent.
- In the Cairngorms National Park 46 per cent of dwellings are in Council Tax bands A-C, whilst for Loch Lomond and the Trossachs National Park, the figure is 35 per cent. This is substantially lower than the average figure for Scotland as a whole, which is 62 per cent.
- When interpreting the figures on Council Tax bands, it is important to note that the Council Tax band reflects the Assessor’s opinion of open market value, subject to a number of statutory assumptions. Assessors base their opinion of value on the actual selling prices of similar properties which sold around the valuation date of 1 April 1991. More information about this can be found on the Scottish Assessors’ website at www.saa.gov.uk.
Type of property
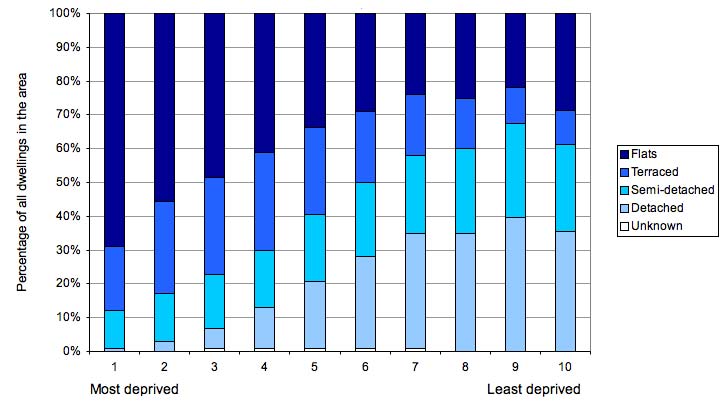
- Figures 1 and 2 show that there are higher proportions of flats in urban areas and in more deprived areas. In contrast, there are higher proportions of detached houses in rural areas and in less deprived areas.
- The three island authorities have the highest percentages of detached dwellings (over 58 per cent of all dwellings in these areas, compared to 21 per cent for Scotland as a whole).
- There are higher proportions of detached properties in the Cairngorms National Park (51 per cent of all dwellings) and Loch Lomond and the Trossachs National Park (46 per cent of all dwellings), compared to 21 per cent for Scotland as a whole.
- The median number of rooms per dwelling is lower in more deprived areas.
Figure 1: Dwelling types by urban-rural classification, 2009
Figure 2: Dwelling types by Scottish Index of Multiple Deprivation (SIMD) decile, 2009
Density of housing
- The density of housing increases from an average of 0.03 dwellings per hectare in remote rural areas to an average of over 10 dwellings per hectare in large urban areas.
- In general, the density of housing increases as the level of deprivation increases, although it increases in the least deprived areas. The most deprived areas have the highest density of housing, with an average of over 15 dwellings per hectare. The least deprived areas have a relatively high density of over five dwellings per hectare. The least deprived areas are often located in urban areas, the high density may partly be due to larger properties being subdivided into flats.
- Glasgow and the Clyde Valley SDP area has a higher average density of housing than the other SDP areas, with an average of 2.5 dwellings per hectare compared to between 0.3 and 0.8 dwellings per hectare for the other three areas.
- The Cairngorms National Park and Loch Lomond and the Trossachs National Park both have low average housing densities (0.02 and 0.04 dwellings per hectare respectively).
3.3 Characteristics of households
Tables 7 to 10 show the percentage of dwellings which are occupied, vacant or second homes. They include the percentage of dwellings entitled to a Council Tax discount because they are occupied by one adult (living alone or with children, or with other adults who are ‘disregarded’ for Council Tax purposes). They also show the percentage of dwellings which are occupied but exempt from paying Council Tax, such as households entirely occupied by students, or armed forces accommodation.
These figures are summarised by urban-rural classification in Table 7, by level of deprivation in Table 8 and by local authority area in Table 9. Summary information is available for each Strategic Development Plan (SDP) area and for Scotland’s two National Parks in Table 10.
These tables highlight the following trends:
Vacant dwellings and second homes
- Across Scotland as a whole, 2.9 per cent of dwellings are vacant and 1.4 per cent are second homes, though there is wide variation across the country.
- Remote rural areas have the lowest percentage of dwellings which are occupied (88 per cent, compared to between 95 and 97 per cent in other areas). This is because remote rural areas have relatively high percentages of vacant dwellings (4.5 per cent of all dwellings in these areas) and second homes (7.3 per cent). Around two to three per cent of dwellings are vacant in other areas and around one to two per cent are second homes. These trends are shown in Figure 3.
- Figure 4 shows that more deprived areas have the highest percentage of dwellings which are vacant (4.5 per cent). In other areas, the figures vary between 1.7 and 3.8 per cent, with the proportion of vacant dwellings generally falling in less deprived areas. The proportion of second homes is lowest in the most deprived areas. It increases as the level of deprivation goes down, before falling again in the least deprived areas. This may be because the greatest concentrations of second homes are found in remote rural areas, which may not necessarily be the most or the least deprived.
- Map 1 shows the percentage of dwellings in each local authority area which are vacant. Over five per cent of all dwellings are vacant in Eilean Siar, Dundee City and Inverclyde.
- The TAYplan SDP area has the highest percentage of vacant dwellings (4.1 per cent). In the other SDP areas, the proportion of vacant dwellings is slightly lower than the national average of 2.9 per cent.
- The Cairngorms National Park has a relatively low percentage of dwellings which are occupied (84 per cent), while the figure for Loch Lomond and the Trossachs National Park is slightly higher (90 per cent). The two National Parks have relatively high proportions of dwellings which are second homes – 12.8 per cent in the Cairngorms National Park and 7.4 per cent in Loch Lomond and the Trossachs National Park. The equivalent figure for Scotland as a whole is 1.4 per cent.
Figure 3: Vacant dwellings and second homes by urban-rural classification, September 2009
Figure 4: Vacant dwellings and second homes by Scottish Index of Multiple Deprivation (SIMD) decile, September 2009
Single adult households
- 38 per cent of dwellings in Scotland are entitled to a ‘single adult’ Council Tax discount. This category includes one adult living alone or with children, or with other people who are ‘disregarded’ for Council Tax purposes.
- The proportion of dwellings entitled to a ‘single adult’ discount is higher in urban areas - 42 per cent in large urban areas compared to 29 per cent of all dwellings in remote rural areas, as Figure 5 shows. This proportion also increases steadily as the level of deprivation increases, from 28 per cent of all dwellings in the least deprived areas to 52 per cent in the most deprived areas. This is shown in Figure 6.
- In both the National Park areas the proportion of dwellings which have a ‘single adult’ discount (28 per cent for Loch Lomond and the Trossachs National Park and 30 per cent for the Cairngorms National Park) is lower than the national average of 38 per cent.
Figure 5: Percentage of dwellings entitled to a ‘single adult’ discount by urban-rural classification, September 2009
Figure 6: Percentage of dwellings entitled to a ‘single adult’ discount by Scottish Index of Multiple Deprivation (SIMD) decile, September 2009
‘Occupied exemptions’
- Urban areas tend to have the highest percentage of dwellings which are occupied and exempt from paying Council Tax, such as all-student households and armed forces accommodation. Urban areas are more likely to have universities and a larger number of all-student households. For instance, the proportion of dwellings with ‘occupied exemptions’ is 6.7 per cent in Aberdeen City (which has two universities) compared with 0.8 per cent of all dwellings in adjacent Aberdeenshire (which has no universities).
- The percentage of dwellings which are occupied and exempt from paying Council Tax is between three and four per cent for Aberdeen City and Shire, TAYplan and SESplan SDP areas. The figure for Glasgow and the Clyde Valley SDP area is slightly lower (2.4 per cent of all dwellings).
3.4 Variation within local authority areas
Scottish Neighbourhood Statistics and data zones
There can be a great deal of variation in household characteristics within a local authority area. The Scottish Neighbourhood Statistics (SNS) website (www.sns.gov.uk) contains statistics for each ‘data zone’ in Scotland, which is a standard geography used for a range of statistics. When first created in 2004, the average data zone was designed to contain around 750 people, which is small enough to provide quite detailed local information and can be aggregated to different areas of interest. The information summarised in this publication is available at data zone level, from the SNS website. This includes the number of dwellings by Council Tax band, type of dwelling, number of rooms per dwelling, density of housing and the percentage of dwellings which are occupied, vacant, second homes, entitled to a ‘single adult’ Council Tax discount, or an ‘occupied exemption’. The SNS website allows users to view tables or maps for individual areas, or to download all the data in order to analyse it further.
Maps 2, 3, 4 and 5 illustrate the types of maps that can be produced to show information at data zone level.
Map 2 shows the percentage of dwellings in each data zone which are vacant. This shows the considerable local variations in the percentages of vacant dwellings in every local authority area. The map also highlights the relatively high percentage of vacant dwellings in remote rural parts of local authorities such as Highland - these cannot be identified by looking at Map 1, which shows figures for each local authority area as a whole. The inset map shows that in general, there are lower percentages of vacant dwellings in much of the Central Belt. However, there are still some data zones with high percentages of vacant dwellings and these might be caused by new builds, long term empty properties or by vacant properties awaiting demolition. There are some data zones in urban areas which contain high concentrations of vacant dwellings. Due to the small land area of data zones in some areas it may not be possible to see these concentrations on the maps. It is possible for users to produce more focused maps using the SNS website.
Map 3 shows the percentage of dwellings in each data zone which are flats. Urban areas and areas closer to the ‘Central Belt’ of Scotland tend to have higher proportions of flats. The inset map shows that there are local area variations in the percentages of flats and these are often in town centres or in cities. In general, remote rural areas have low percentages of flats.
Map 4 shows the percentage of dwellings which are second homes for each data zone in Scotland. The map shows that there are wide variations in the proportions of second homes within many local authority areas, such as Highland and that there are relatively high numbers of second homes in remote rural areas.
Map 5 shows the percentage of dwellings with ‘occupied exemptions’ in North East Fife and Dundee City. This gives an illustration of the two main types of dwellings which are occupied but exempt from paying Council Tax. The area in the centres of Dundee and the whole of St Andrews contain relatively high numbers of all-student households. There are also areas of armed forces accommodation at Leuchars in Fife.
Maps 2, 3, 4 and 5 provide useful illustrations of the data, but it is not possible to include detailed data zone maps for every part of Scotland within this publication (though users can produce their own maps at www.sns.gov.uk). An alternative way of illustrating the variation within a local authority area is through the use of boxplots.
Figures 7, 8, 9 and 10 use boxplots to illustrate the variation within each local authority area. These show the percentage of dwellings in each council area which are vacant, are second homes, have ‘single adult’ discounts, or are classed as ‘occupied exemptions’. Boxplots show the middle ranked data zone and they also show the level of variation – the larger the box, the more variation there is within that local authority area. An illustration of a boxplot is shown below.
Example of a boxplot (the percentage of dwellings which are vacant in each data zone in North Ayrshire)
The example given above shows the percentage of dwellings which are vacant in each data zone in North Ayrshire (from Figure 7). This shows that in half the data zones in North Ayrshire, up to two per cent of dwellings are vacant, but that the proportion varies across the local authority area. In the five per cent of data zones with the lowest figures, less than one per cent of all dwellings are vacant. In the five per cent of data zones with the highest figures, more than seven per cent of dwellings are vacant.
Figures 7, 8, 9 and 10 confirm some of the trends seen in the previous tables:
- In general, there are more vacant dwellings in the more rural local authority areas, including the island authorities. However, there are a few data zones with particularly high numbers of vacant dwellings (where over 10 per cent of dwellings are vacant) in some other local authority areas including Inverclyde, Dundee City and Glasgow City.
- There are also generally more second homes in the more rural local authority areas including the island authorities. In North Ayrshire, over eight per cent of all dwellings on the Islands of Arran and Great Cumbrae are second homes compared with much lower proportions in other parts of the local authority area.
- There tend to be more dwellings with ‘single adult’ discounts in the urban local authority areas, though there is a lot of variation within every local authority area. This category includes one adult living alone or with children, or with other people who are ‘disregarded’ for Council Tax purposes.
- Most local authority areas have relatively few dwellings entitled to ‘occupied exemptions’. The exceptions tend to be areas with large student populations (e.g. City of Edinburgh, Dundee City, Glasgow City, Aberdeen City and Stirling) and areas with armed forces bases (e.g. Moray, City of Edinburgh and Argyll & Bute). These areas tend to be quite concentrated – the median number of ‘occupied exemptions’ in these local authority areas is less than three per cent, but they have a few data zones with far higher figures. Map 5 shows that there are a small number of data zones in Fife with very high proportions of dwellings entitled to ‘occupied exemptions’. These are within the highest five per cent in the local authority area and are so are not shown in the boxplots.
3.5 Changes in household size and type
Table 11 and Figure 11 show information on changes in household size and type, taken from the Scottish Household Survey. These show that the average household size is getting smaller, with more people living alone and in smaller households. Between 2003 and 2008, the number of households containing just one adult has increased by seven per cent and the number of two adult households also increased by seven per cent. There has been an overall increase in the number of households containing one adult with children since 1991, although the number of households of this type has declined in recent years. There has been an overall decline in the number of households containing two or more adults with children since 1991. The changes in household composition have contributed to a five per cent increase in the number of households in Scotland between 2003 and 2008. This is more than double the increase in the population over this time.
previous | contents | next