Chapter 2: Population
"Scotland’s population increased in the year to June 2019, and has continued to age."
Population and COVID-19
This chapter explores the size and characteristics of Scotland’s population. The population estimates are updated each year, with the latest figures relating to the population as at 30 June 2019 (commonly referred to as mid-2019). Population projections are published every two years, and the most recent projections are based on the mid-2018 population.
As a result, these statistics do not take into account recent changes, such as the increase in deaths due to COVID-19, or the changes to migration as a result of travel restrictions imposed during the pandemic. Further information on the latest deaths involving COVID-19 can be found in Chapter 1 – Deaths involving COVID-19, and some insights into recent travel patterns can be found in Chapter 6 – Migration.
Next year, we will be able to use the mid-2020 population estimates to improve our understanding of the impact of the pandemic on Scotland’s population. Nevertheless, the latest statistics in this chapter can provide some helpful insights into the current demographic makeup of Scotland. We know that older people are more at risk of becoming seriously ill from COVID-19, so these statistics can be used to quantify the older population, and how this varies across different areas of Scotland.
Scotland’s population
As seen in Figure 2.1, Scotland’s population experienced growth each year between mid-1855 and mid-1911, when it reached 4,751,100. Population growth slowed until mid-1975, when there was over a decade of population decline. Between mid-1988 and mid-2000, the growth in Scotland’s population stalled.
Scotland’s population reached its highest ever level in mid-2019
The population has grown each year since mid-2000. According to most recent estimates, Scotland’s population was 5,463,300 in mid-2019. This was an increase of 0.5% (25,200 people) on the previous year.
Figure 2.1: Estimated population of Scotland, mid-1855 to mid-2019
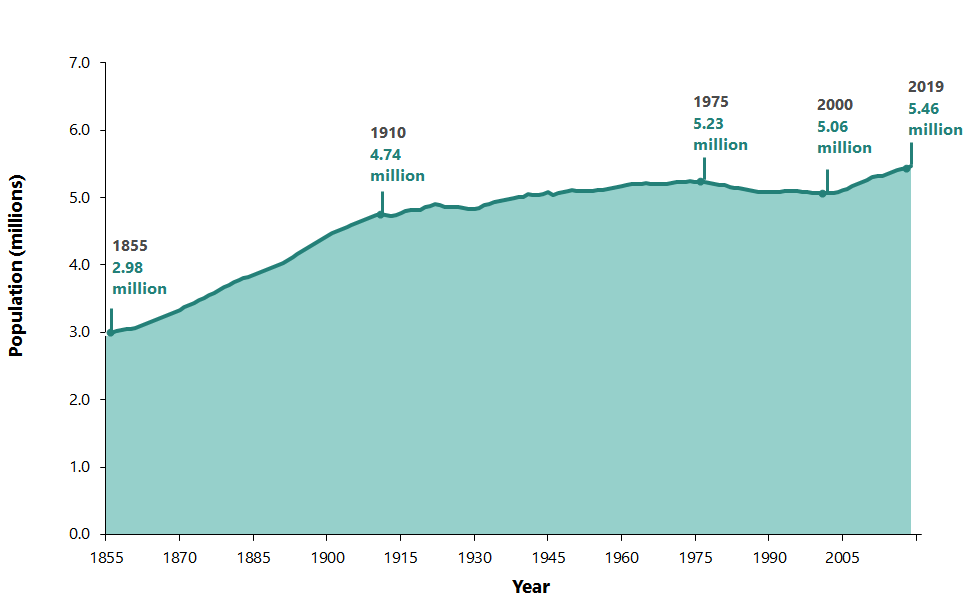
Note: The populations for 1940 to 1946 are imputed due to estimation issues during World War Two.
7 councils have experienced population decline over the past ten years
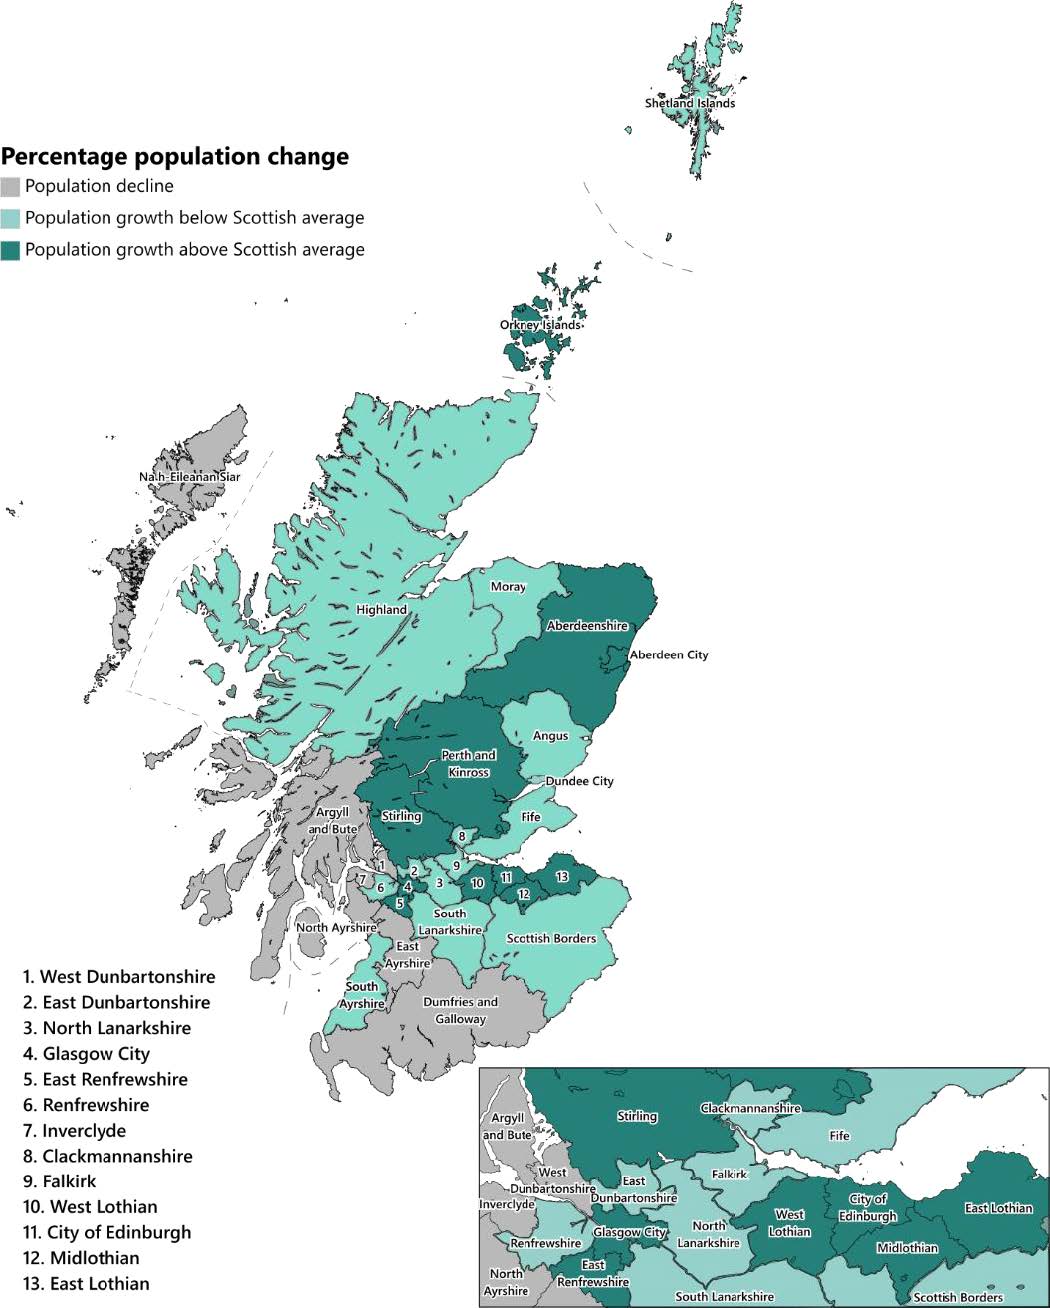
Over the past ten years (mid-2009 to mid-2019), Scotland’s population has increased by 4% (231,400 people). However, population change has varied across Scotland. A total of seven (out of 32) councils have experienced population decline (Figure 2.2). These councils are predominately located in the west and south-west of the country.
The councils which experienced greatest population decline over the past decade were:
- Inverclyde (down by 5%)
- Argyll and Bute (down by 4%)
- Na h-Eileanan Siar (down by 3%)
Councils which experienced population growth above the Scottish average (4%) were mainly in the central belt or east of the country. The fastest growing councils were:
- City of Edinburgh and Midlothian (both up by 13%)
- Glasgow City and East Lothian (both up by 9%)
Figure 2.2: Estimated population change, council areas, mid-2009 to mid-2019
Every council area had pockets of population growth as well as population decline
Councils are made up of small areas called data zones. They are designed to have a population of around 500 to 1,000 people. NRS publish small area population estimates for these data zones annually, which can be used to understand how communities are changing.
Over the past decade1 to mid-2019, over half (54%) of all data zones in Scotland experienced population decline (3,795 out of 6,976 data zones). In every council area, there were some data zones where the population grew, and some where it declined.
Remote small towns2 had the highest proportion (70%) of data zones which experienced population decline. In contrast, large urban areas (57%) and accessible rural areas (56%) had the highest proportion of data zones which experienced population growth. This is illustrated in Figure 2.3.
1Data zone boundaries are reviewed after each census. Mid-2009 population estimates have been rebased using the 2011 Data Zone boundaries.
2According to 6-fold urban rural classification. Further information on the Scottish Government Urban Rural classification can be found on the Scottish Government website.
Figure 2.3: Percentage of Data Zones and population change by 6-fold Urban Rural Classification, mid-2009 to mid-2019
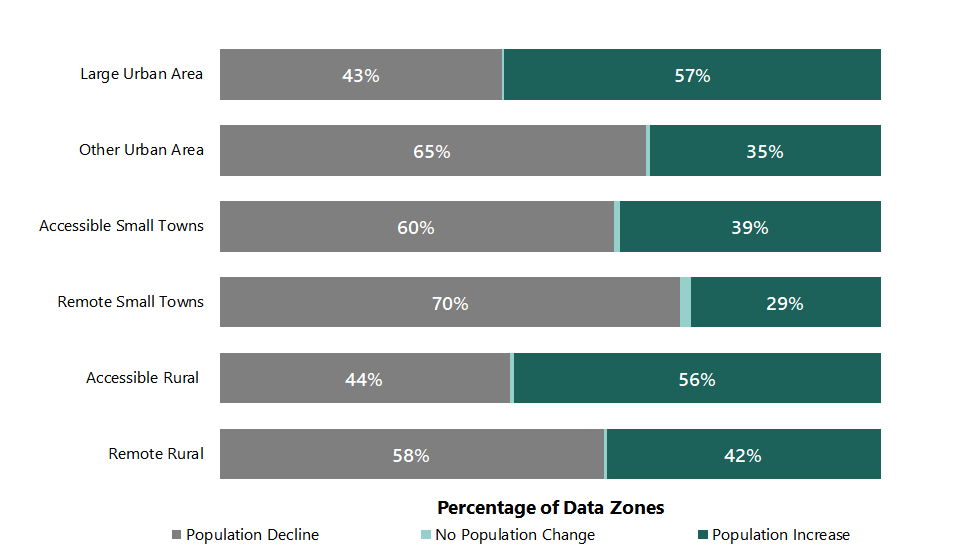
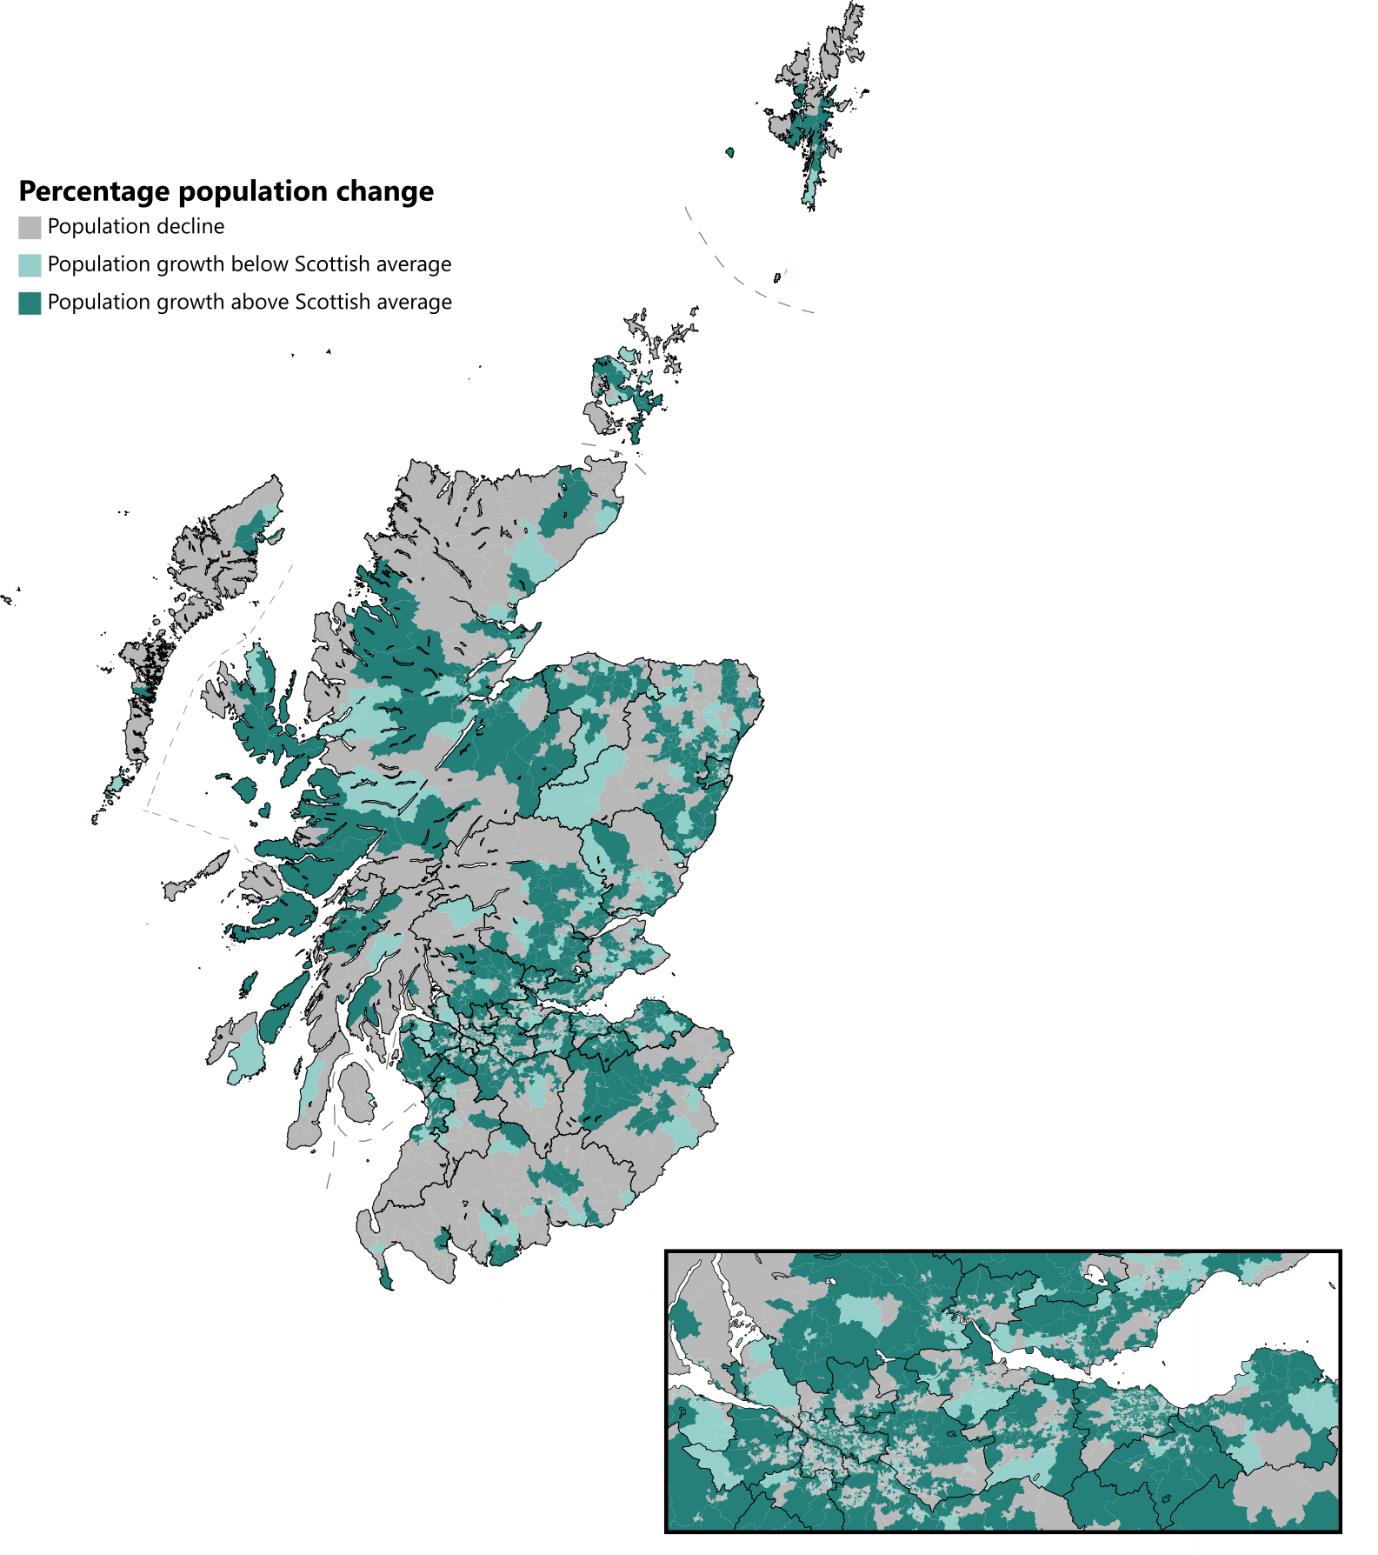
Figure 2.4 shows that there have been pockets of population growth and population decline in Scotland over the past ten years to mid-2019.
The data zones which experienced population growth are mostly concentrated in Scotland’s Central Belt (Figure 2.4). There are also more pockets of these data zones located in the north and north-east of Scotland. Population decline mostly occurred in data zones concentrated in the south of the country. There were also large pockets of data zones which experienced population decline to the north of the country and in the islands.
Did you know? You can use NRS’ interactive tool to explore the small area population estimates in more detail? It allows users to enter a postcode, find out the data zone it falls within and how the population of the local area is changing.
Figure 2.4: Population change, data zone, mid-2009 to mid-2019
Scotland’s National Performance Framework (NPF) includes a population indicator reflecting the importance of monitoring progress and understanding the demographic challenges in Scotland
The NPF indicator measures the number of councils experiencing population decline. Over the latest year to mid-2019, 8 council areas experienced a falling population (mostly island and rural areas, as well as areas in the west of Scotland). This is an improving position from 14 council areas in mid-2018.
The Scottish Government’s Population Taskforce uses the NPF and other indicators to monitor progress and understand the challenges facing Scotland’s population. Through this Taskforce, the Scottish Government will work closely with partners to develop and publish a Population Strategy in early 2021 as set out in ‘Protecting Scotland, Renewing Scotland: The Government’s Programme for Scotland 2020-21.’ The strategy will set out the actions the Scottish Government and local partners will take to address Scotland’s demographic challenges
Why is the population changing?
Migration is driving the growth in Scotland’s population
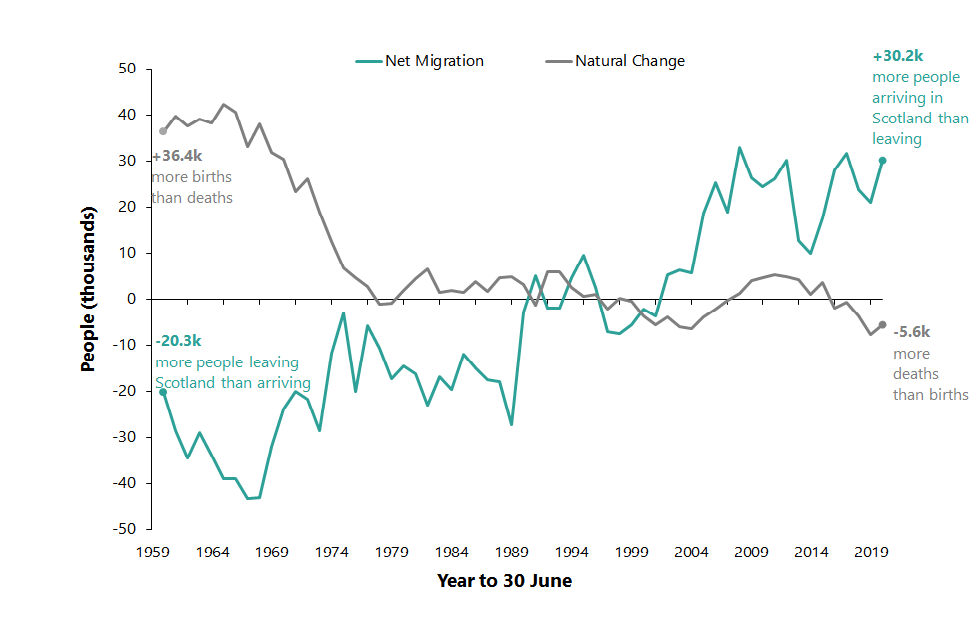
There are two main components which drive change in the population. These are natural change (births minus deaths) and migration. As shown in Figure 2.5, net migration has been positive (more people arriving than leaving) in Scotland since the year ending mid-2001. In the latest year to mid-2019, 87,400 people came to Scotland and 57,100 people left, meaning net migration was 30,200. Further information on migration can be found in Chapter 6 - Migration.
Natural change remained relatively stable until the middle of the 1960s, at which point it began to decline (Figure 2.5). This was because birth rates started falling. The first time natural change did not contribute to population increase was in the year to mid-1977, when there were more deaths than births. In the most recent year to mid-2019, there were 5,600 more deaths than births. This is the fifth consecutive year that there have been more deaths than births. More detailed information about trends in births and deaths can be found in Chapter 3 – Births and Chapter 4 – Deaths.
Figure 2.5: Estimated natural change and net migration (thousands), mid-1959 to mid-2019
Migration has driven population change in most areas of Scotland over the past ten years to mid-2019. As seen in Figure 2.6, only five councils had more people leaving than arriving:
- Inverclyde (1,530 more people leaving)
- West Dunbartonshire (1,270 more people leaving)
- Shetland Islands (300 more people leaving)
- North Ayrshire (250 more people leaving)
- Clackmannanshire (80 more people leaving
Most councils (21 out of 32) had more deaths than births over the past decade
Areas with the greatest population change due to positive net migration (more people arriving than leaving) were the City of Edinburgh and surrounding councils - Midlothian and East Lothian (Figure 2.6).
Only one third (11 out of 32) of councils experienced population growth as the result of natural change (more births than deaths) over the past decade (Figure 2.6). In the majority of these council areas, this growth was lower than growth due to migration.
Where are people moving from and to?
Most overseas and UK moves are to and from the city councils. Between mid-2009 and mid-2019, the highest number of moves were:
Most common moves to Scotland |
Number of moves |
|---|---|
| Overseas to Glasgow City | 98,840 |
| Overseas to City of Edinburgh | 96,730 |
| Rest of UK to City of Edinburgh | 92,290 |
Most common moves from Scotland |
Number of moves |
|---|---|
| City of Edinburgh to Rest of UK | 74,960 |
| Glasgow City to Rest of UK | 55,820 |
| Aberdeenshire to Aberdeen City | 43,700 |
The most common moves within Scotland, with the exception of Aberdeenshire to Aberdeen City, were from cities to neighbouring council areas.
Most common moves within Scotland |
Number of moves |
|---|---|
| Aberdeen City to Aberdeenshire | 35,600 |
| Glasgow City to South Lanarkshire | 26,170 |
| Aberdeenshire to Aberdeen City | 22,900 |
Further information on migration in Scotland can be found in Chapter 6 - Migration
Figure 2.6: Components of change2 , council area, mid-2009 to mid-2019
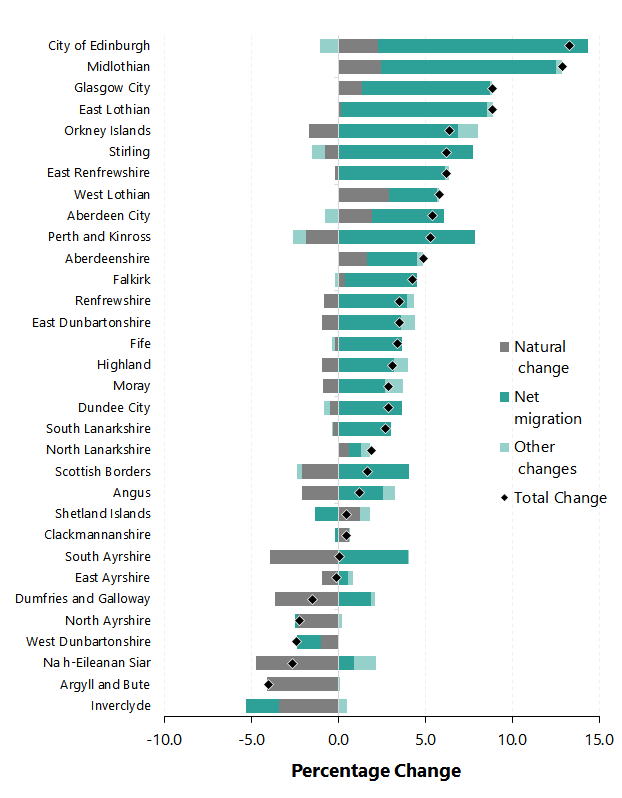
2Other changes include changes to the prison and armed forces population as well as small rounding adjustments.
Population ageing in Scotland
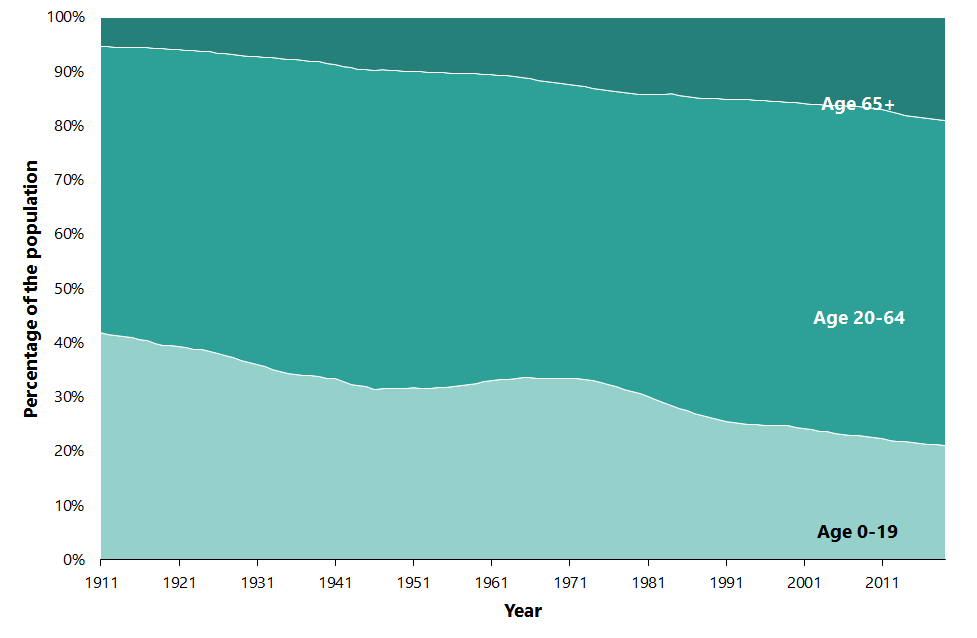
The number of older people in Scotland has been increasing for decades (Figure 2.7). In mid-1911, only 5% of Scotland’s population was aged 65 and over. This age group now makes up 19% of the population, according the most recent estimates in mid-2019. In comparison, people aged 0 to 19 has shrunk from 42% to 21% of Scotland’s population during this same time period.
Over the past ten years to mid-2019, Scotland’s population has changed as follows:
- 4% decrease (-41,900 people) in people aged 0 to 19
- 3% increase (+99,700 people) in people aged 20 to 64
- 20% increase (+173,600 people) in people aged 65 and over
Figure 2.7: Percentage of the population by age group, Scotland, 1911-2019
We know older populations are more at risk of COVID-19. In Scotland, there are 465,800 people aged 75 and over as at mid-2019. From the latest death statistics, we know that more than three quarters (77%, 3,269 people) of all deaths involving COVID-19 up to the 27th of September were of people aged 75 and over. Further information on COVID-19 deaths by age group can be found in Chapter 1 – Deaths involving COVID-19.
Table 2.1 shows the top 10 data zones in Scotland with the highest proportion of people aged 75 and over. The data zones with the highest proportion of people aged 75 and over are mostly located in other urban areas according to the Scottish Government 6-fold Urban Rural Classification. Each of these data zones contain care homes or other developments aimed at older populations.
Further information on the age distribution of data zones in Scotland can be found in Small Area Population Estimates on the NRS website.
Table 2.1: Top 10 data zones with highest proportion of population aged 75+
| 2011 DataZone | Council | Population | Proportion aged 75+ |
|---|---|---|---|
| Ayr South Harbour and Town Centre – 07 | South Ayrshire | 670 | 42% |
| Falkirk – Town Centre and Callendar Park – 02 | Falkirk | 760 | 40% |
| Kessington West – 01 | East Dunbartonshire | 630 | 33% |
| Dundyvan – 08 | North Lanarkshire | 1,050 | 33% |
| Elgin Cathedral to Ashgrove and Pinefield – 04 | Moray | 710 | 32% |
| Blairgowrie West – 07 | Perth and Kinross | 870 | 32% |
| Bothwell South – 04 | South Lanarkshire | 410 | 32% |
| Monifieth East – 02 | Angus | 750 | 30% |
| Earlsferry | Fife | 380 | 30% |
| Helensburgh North – 07 | Argyll and Bute | 870 | 30% |
How is Scotland’s population projected to change?
Scotland’s population is projected to increase at a slower rate than seen in recent years
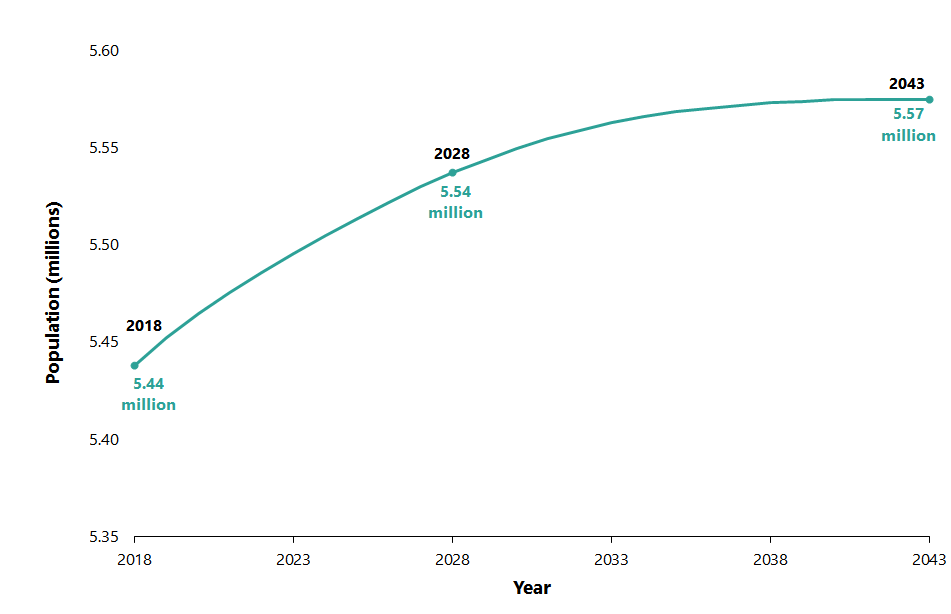
Scotland’s population is projected to increase by 2% (+99,000 people) over the 10 year period between mid-2018 and mid-2028, and increase by a further 0.7% (+37,700 people) to mid-2043 (Figure 2.8).
Whilst Scotland’s population is projected to increase in future, the rate of population growth is projected to be slower than in recent years. If the projections are realised, growth could stall by mid-2043.
Figure 2.8: Projected population of Scotland, mid-2018 to mid-2043
More councils are projected to have population decline in future
Population change is projected to vary across Scotland, with some councils projected to increase whilst others decrease.
The areas which are projected to experience population decline between mid-2018 and mid-2028, are mainly concentrated to the west and south-west of Scotland (Figure 2.9). There are projected to be more councils (14 out of 32) facing population decline in the 10 years to mid-2028, than between mid-2009 and mid-2019 (7 out of 32).
In contrast, councils which are projected to experience the greatest population growth are the cities of Glasgow, Edinburgh and Stirling, and the surrounding councils (Figure 2.9).
How is population projected to change within councils?
Working in collaboration with NRS, the Improvement Service have produced a set of 2018-based sub-council area population projections, using a standard geography specified by users in each council across Scotland.
These projections are available on the Improvement Service website.
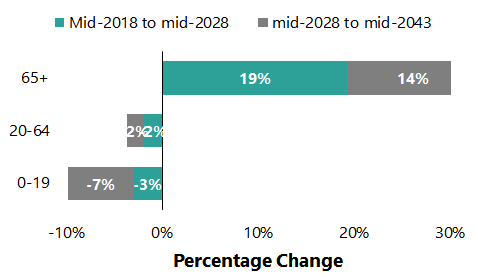
Scotland’s population is projected to continue to age over the 25 year period between mid-2018 and mid-2043 (Figure 2.10). Between mid-2018 and mid-2028, there is projected to be a 19% (198,000 people) increase in people aged 65 and over in Scotland. This is projected to continue increase but at a slower rate of 14% (166,600 people) over the next 15 years to mid-2043 (Figure 2.10).
The 20 to 64 year age group is projected to decrease by 2% (64,100 people) between mid-2018 and mid-2028. This age group is projected to decrease a further 2% (53,600 people) over the next 15 years to mid-2043 (Figure 2.10).
The youngest age group, those aged 0 to 19 is projected to have the largest decrease during this period. It is projected to decrease 3% (34,800 people) between mid-2018 to mid-2028 and continue to decrease by 7% (75,200) until mid-2043 (Figure 2.10).
Figure 2.9: Projected population change, council area, mid-2018 to mid-2028
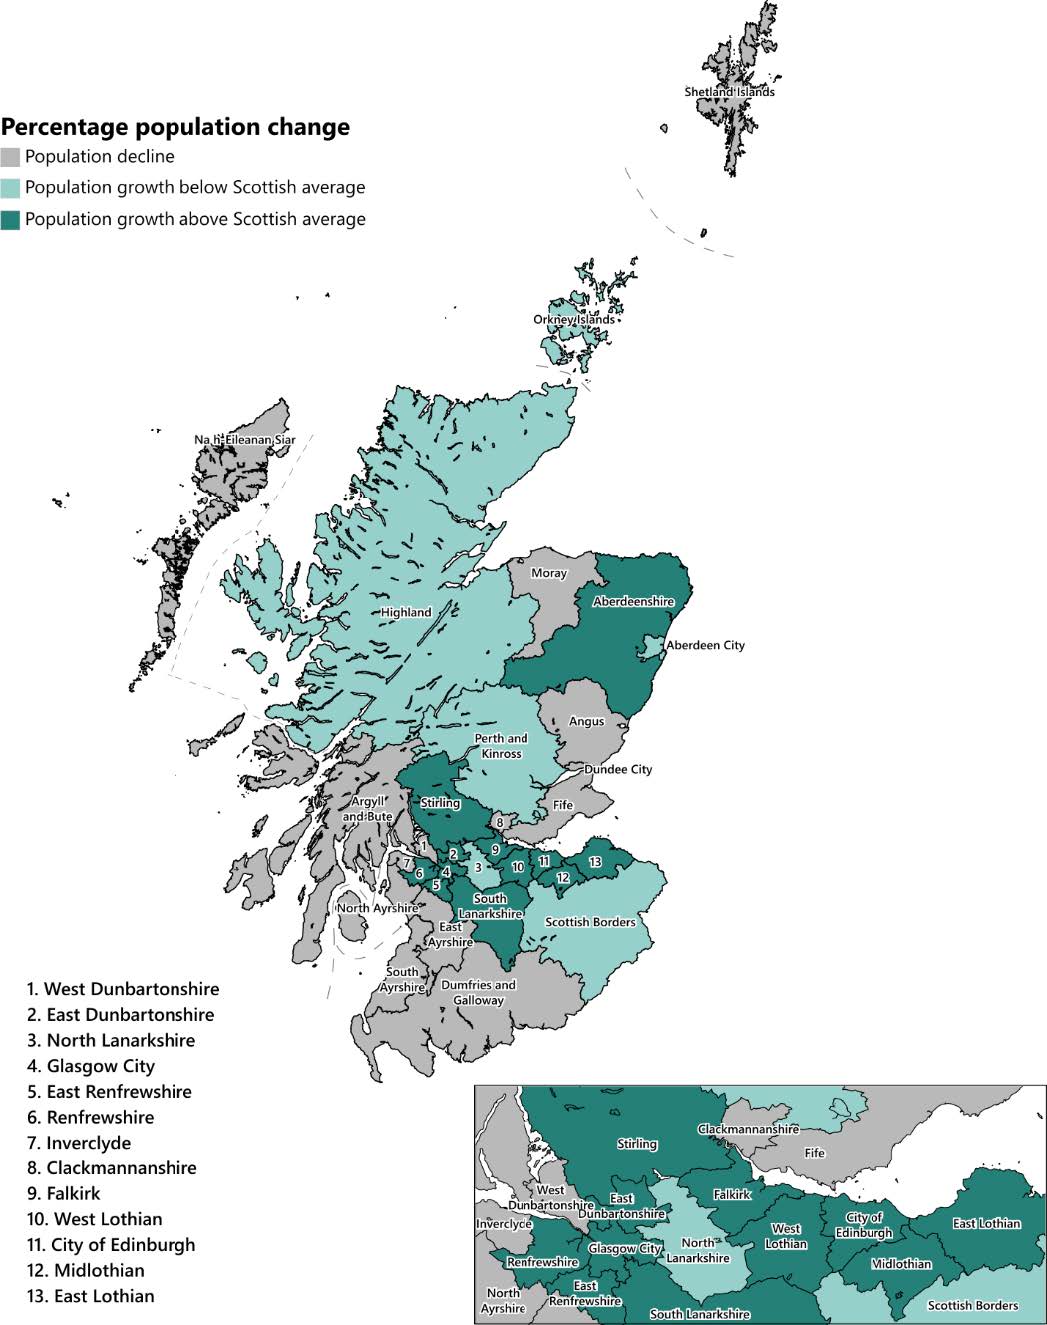
Figure 2.10 Projected percentage change by age group, Scotland, mid-2018 to mid-2028
How is population changing in Scotland compared to the rest of the UK?
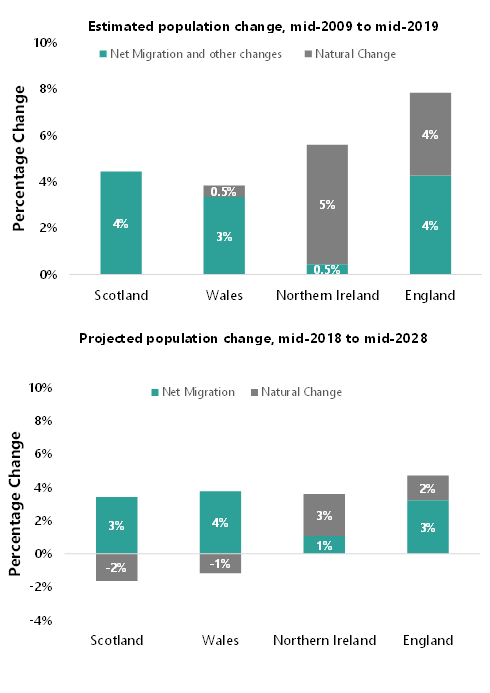
Between mid-2009 and mid-2019, all countries in the UK experienced population growth. Of the constituent countries in the UK, Wales had the slowest population growth (+3.8%), followed by Scotland (+4.4%). Scotland was the only country where natural change (births minus deaths) did not contribute to population growth (Figure 2.11).
How do population projections compare to estimates?
Population projections are statistics on the potential future size of Scotland’s population. They are based on past-trends and assumptions of fertility, mortality and migration.
Population estimates often differ from population projections due to changes in fertility, life expectancy and net migration. The 2018-based projections, projected that the mid-2019 population would be 5,452,400. This is 0.2% lower than the actual mid-2019 estimate (5,463,300). This difference can be explained by higher migration than projected.
Variant projections are produced based on alternative assumptions of future fertility, mortality and migration. They show other plausible scenarios of what the future could look like. Explore the variant projections using our interactive visualisation.
Between mid-2018 and mid-2028, all countries in the UK are projected to increase in population, but at a slower rate than the previous decade (Figure 2.11). Scotland’s population growth is projected to be the slowest in the UK.
Scotland is projected to have the greatest decrease in population due to natural change (more deaths than births). As a result, Scotland is the most reliant on migration for population growth.
Figure 2.11: Estimated and projected population change3 in Scotland and constituent countries in the UK