Scottish Settlements Urban and Rural Areas in Scotland
Scottish Settlements Urban and Rural Areas in Scotland
Results
Settlements in 2000
7. The attached set of maps shows the results of this year's exercise. Larger scale versions of the maps are available from the Scottish Executive Geographic Information Service (contact details in paragraph 21).
8. Of the estimated population of 5,119,200 in Scotland at mid-1999, some 4,648,010 (90.8 per cent) were assigned to 514 settlements covering 2.2 per cent of the land surface.
9. For Scotland as a whole there were 0.66 persons per hectare. This density averaged 27.16 in the settlements and 0.06 outside.
10. The largest settlement was Glasgow, which spread into 7 council areas: East Dunbartonshire, East Renfrewshire, Glasgow, North Lanarkshire, South Lanarkshire, Renfrewshire and West Dunbartonshire. The Glasgow settlement contained a population of around 1,090,530, some 21% of the population of Scotland.
11. There were 4 other settlements that contained more than 100,000 population each. These 4 settlements along with the Glasgow settlement contained some two-fifths of the population of Scotland. Table 1 shows the number of settlements by settlement size and the proportion of the Scottish population living in each size band. Also shown is that, in general, the density of population increases with size of settlement.
12. The council areas with proportionally the largest urban population were Glasgow City, the City of Edinburgh, and Dundee City with over 99 per cent of the population in settlements. Others with at least 98 per cent of the population in settlements were Aberdeen City, East Renfrewshire, Renfrewshire and West Dunbartonshire. Council areas with proportionally the least population in settlements were the three island areas of Eilean Siar, Orkney and Shetland with 54 per cent or less. Mainland Council areas with fewer than 70 per cent of their population in settlements were Aberdeenshire, Argyll & Bute, Dumfries & Galloway and Highland. The first column of Table 2 shows details.
13. It should be noted that the criteria used to define an 'urban' postcode - a preliminary stage in defining settlements - varied for some council areas. This was in order to provide some continuity with the exercise to define 'localities' for the 1991 Census. Refer to paragraphs 8 and 9 of Annex B.
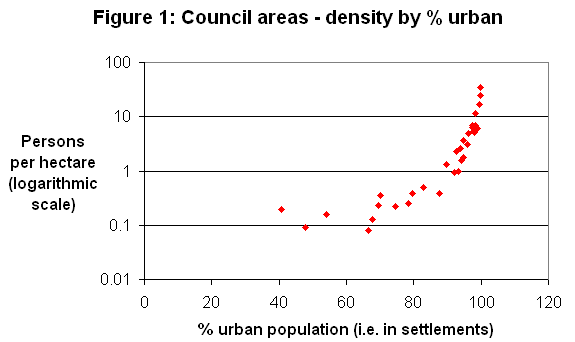
14. As might be expected, the higher the proportion of the population in settlements in a council area, the more densely populated it is. However, the relationship is far from linear even when plotted using a logarithmic scale (go to Figure 1).
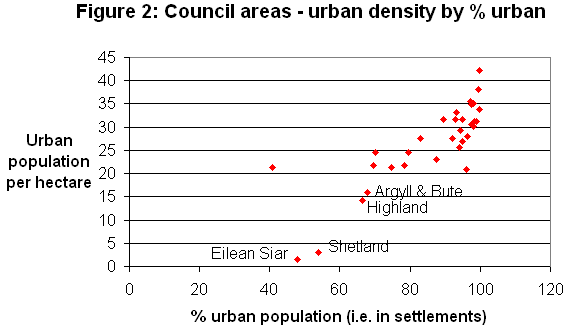
15. This can be explained more clearly from Figure 2, which shows urban density by proportion of the population in settlements. While the figure does appear to show a linear relationship it is not the one that we would expect. Ideally the line should be horizontal, indicating that all urban areas have roughly the same population per hectare.
16. Table 2 shows this variation in the population density within settlements in more detail. This density was particularly low in the island areas of Eilean Siar and Shetland - no doubt reflecting the low density thresholds used to identify urban postcodes in these areas. (The setting of thresholds will need to be re-examined with related factors in any future exercise - refer to paragraph 18 of Annex C.) The mainland council areas of Highland and Argyll & Bute also had relatively low population densities within settlements. These four council areas are shown in Figure 2.

